Our Outage Map is a powerful tool designed to give our members real-time information during a power outage. Below is a guide to help you understand the various features contained in our map.
**All descriptions reference accessing our Outage Viewer on a mobile device.
Outage Map Legend
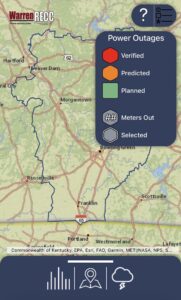
Legend View
In the top right-hand corner is a large question mark. Click on the lines beside it to see a map legend.
Verified: An outage is classified as verified when either a Warren RECC crew member has physically visited and verified the outage or if our Outage Management System has verified that the power is out.
Predicted: An outage that is classified as predicted means that our Outage Management System is predicting (via member reports and monitoring systems) the device is out of power.
Planned: From time to time, we may need to plan an outage in order to safely perform necessary work.
# Meters Out: The number of meters out indicates how many meters are affected at each outage.
Selected: Outage Viewer users can select a specific outage for more information on that specific outage, including start time, meters impacted, and streets affected.
Icons at the Bottom of the Map
At the bottom of the page is a large tab with 3 icons.
Graph Icon
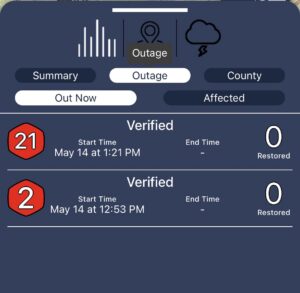
Outage Tab in Summary View
The Graph icon includes 3 different tabs: Summary, Outage, and County:
Summary: This area gives a summary of current outage events, including a graph that shows the number of metered out over the last 48 hours.
Outage: Lists individual outages. This area will also show the appropriate symbols from the legend for each outage (planned, predicted, verified). The number inside the symbol indicates how many meters are without service in that outage. This section also shows the estimated end time of the outage and the number restored in each outage.
County: The County section groups meters that are out of power by county, provides the total number from each outage, percentage of the county affected, total meters per county, and the number from each that has been restored.
Map Icon
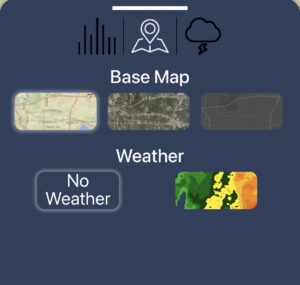
Base Map Options
The map tab allows you to customize the base layer of your outage map. Choose between topography, satellite, and night time views. Additionally, you can choose whether or not to add a weather radar layer.
Weather Icon
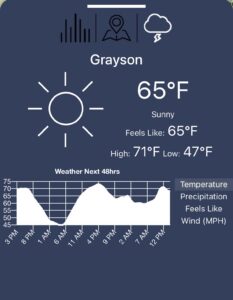
Weather View Options
This section shows the current weather conditions in the Warren RECC service territory. On the right hand side, toggle through temperature, precipitation, feels like, and wind options to show a graph of the forecast for the next 48 hours for each county.